
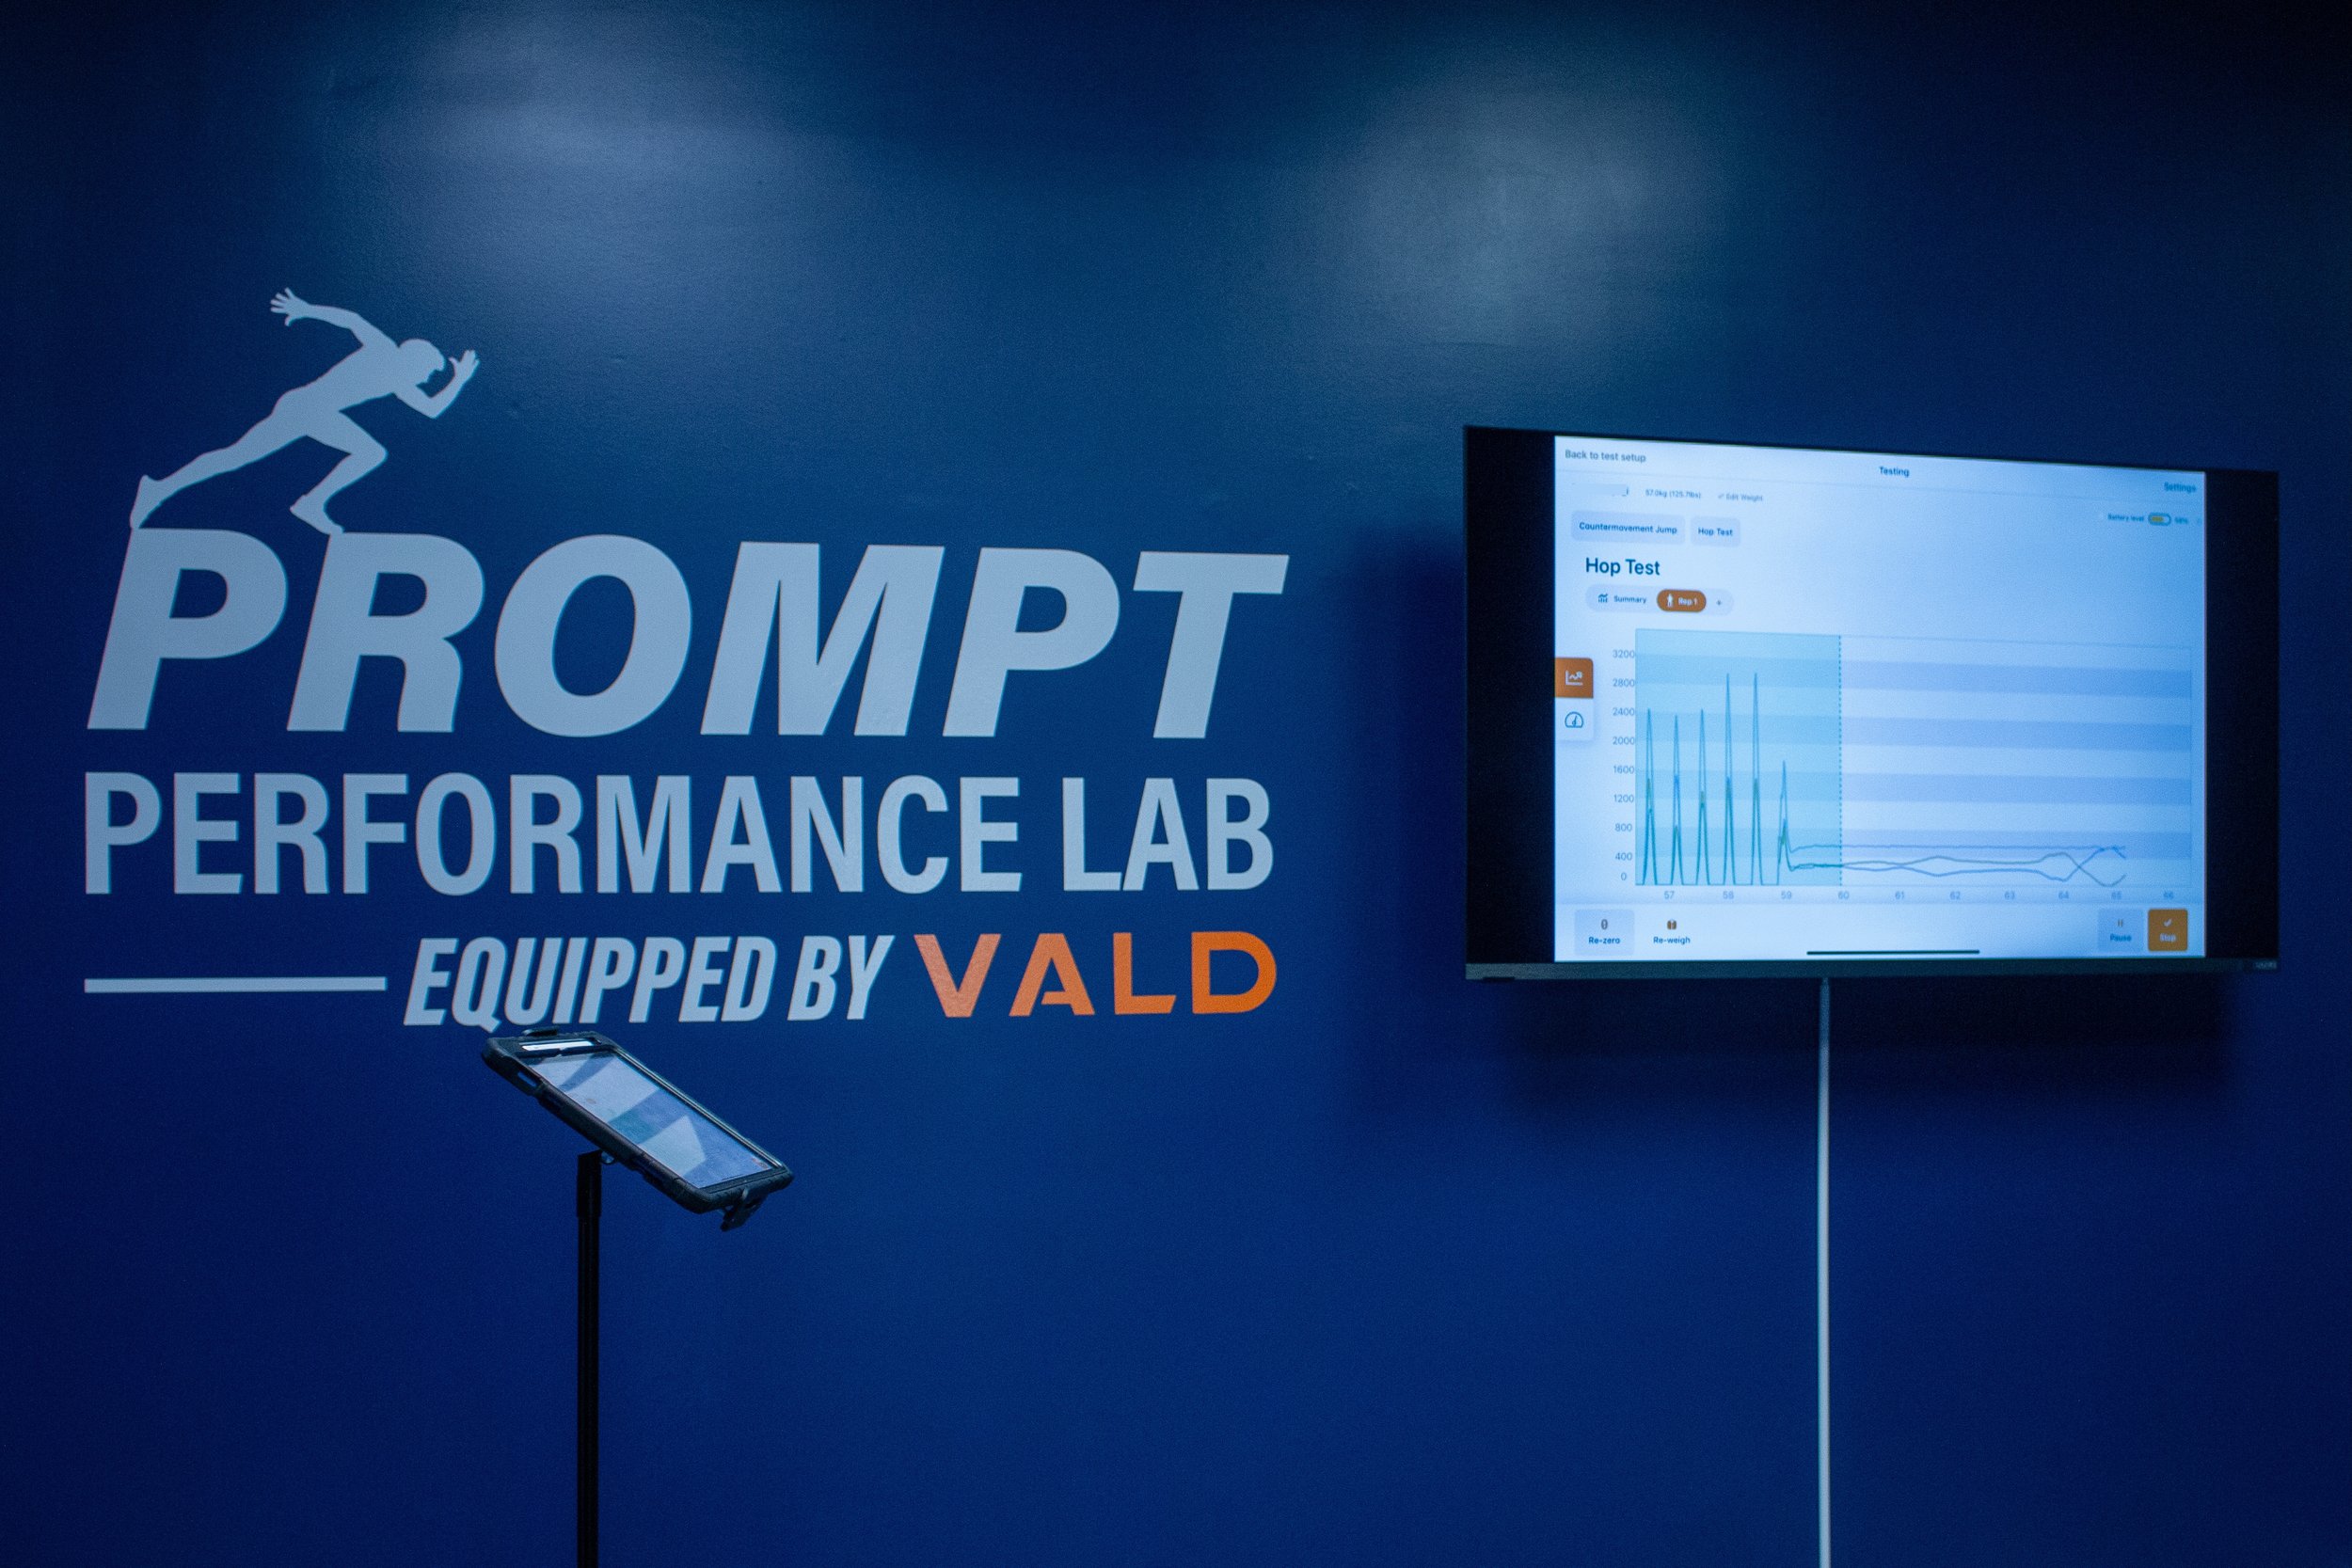
The Run Lab
POWERED BY PROMPT PHYSICAL THERAPY
real Run lab results
-
![Colin Eckerman racing for Fruman university cross country]()
Colin Eckerman - Furman University
Tennessee 2023 XC State Champ 2024 1600m State Champ
Since July 2023, I've had the pleasure of working closely with Paul Wilson. What sets Paul apart is his unique approach to physical therapy, he delves deeper into understanding my specific needs as a runner. Together, we've crafted a personalized strength training regimen that targets my strengths and weaknesses, resulting in remarkable improvements in my performance. Paul's dedication to his craft is evident in every session. His commitment to my success extends beyond the clinic walls, as he provides ongoing support and guidance to help me reach my goals.
-
![The badge of Farragut High School, featuring a central shield with a cross, a lantern, a sailing ship, a book, and a scale of justice, surrounded by a wreath and the words 'Farragut High School' and 'Est. 1904', with a banner displaying the school's motto 'Scientia Integritas Diversitas Excellentia'.]()
Chelsea Osborne - FARRAGUT HIGH SCHOOL Track & Cross Country
Our team started working with Paul at the beginning of the 2024 season. He has been a great asset to our strength program this year. He takes time out of his busy schedule to teach the athletes each exercise and is always accommodating when we need to adjust things. I would recommend Paul to any team that is looking to develop a strength program specifically for our sport.
-
![Colleen Little, Paul's former boss at Nike]()
Colleen Little, PT, DPT, OCS
Team Physical Therapist & Strength Coach Nike Bowerman Track Club
Paul is one of the best when it comes to working with runners, not only for rehab, but even more importantly, for performance and injury prevention. He takes the time to make programs specific to each athlete's needs and goals which is sometimes hard to find. Paul stays on top of all the recent research and implements new ideas constantly into his programming. If you want to improve your running and decrease your risk of injury, I couldn't recommend Paul more
-
![Austin Rhea, school record holder in Track]()
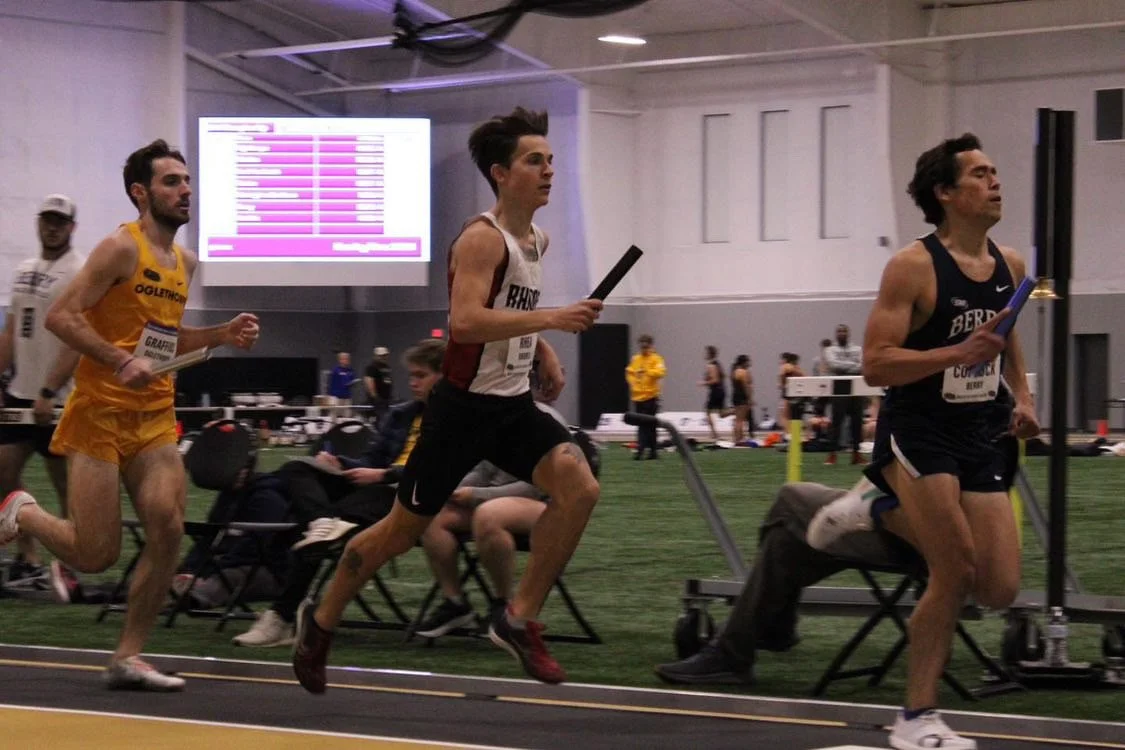
Austin Rhea, Rhodes College XC/Track
Since working with the team, I've noticed a significant improvement in my overall running strength and explosiveness. I feel much more springy during my runs and plyometric exercises, which has noticeably enhanced my efficiency. During races, I get less fatigued as the effort goes on, allowing me to maintain form and energy through the finish.
The customer service has been excellent. I was able to clearly communicate my injury to Paul, and he crafted a plan that was not only tailored to help me recover but also aligned with my future running goals. His personalized approach made a big difference in my rehabilitation and performance.
One standout result is the improvement in my force production, which was measurable through the force plates. This boost in power has translated directly into better race performances and overall efficiency.
-
![The garmer Twins, State champs and D1 commits for Cross country and Track]()
David Garmer, Daughters Jazz and Calysta, Webb XC and Track
Paul has been a game changer for my daughters. They have had significant improvements in their cross country and track running performance since working with Paul. They’ve seen major improvement in their strength which has been a major boost to their confidence knowing they’re putting effort in on something that’s customized for them and they’ll see great results from.
Paul is very knowledgeable and customizes their programs for where they are individually and to maximize performance at the races that matter most.
We would recommend Paul to anyone looking for improvement with their running performance. He’s very passionate about working with athletes and building custom strength plans for the individual. For my daughters he’s been a critical part of their team in helping them accomplish their goals!




Stronger runners start with better data
Generic plans miss your limiter
Most strength plans for runners treat everyone the same. Your weak link is specific to you.
Small gaps add up
A 10% difference side to side repeats on every stride, for thousands of strides a week.
Feel only tells you so much
Force plates show how you actually produce and absorb force, so training targets what matters.
You deserve a plan built on your data, not a template.
Sample reports
See exactly what is holding you back
Pro and Elite runners get a color-coded profile. Each test is scored against endurance-athlete norms, both legs are checked for imbalances, and your top priorities are named in plain language. Below are three real runners.
Run Lab Profile
A real client, shared without identifying details. Female marathon runner in her 40s, scored against VALD female endurance norms.
- Hamstring Right85%
- Hamstring Left101%
- Knee Iso-Push100%
- Ankle Iso-Push115%
- Hip 45°113%
- Hop RSI114%
- Countermovement Jump102%
The read
A strong, well-built runner. Six of seven force measures sit at or above target, and her jump and reactive numbers climbed double digits since the last test. The right hamstring is the one exception. It is the lone deficit, the lone red flag, and the only measure that went backward.
Top priorities
- 1Right hamstring strength. At 85% of target, and down slightly since the last test while the left side gained.
- 2Close the side-to-side gap. A 15.6% hamstring difference is the only imbalance over the line.
- 3Keep building power. Jump height is up 23.5%. The plan protects that momentum.
Left vs right
The marker shows the 10% flag line. Amber is 10 to 15%, red is 15% or more.
Keep scrolling for a professional runner profile.
Run Lab Profile
A real client, shared without identifying details. Professional female runner, scored against VALD female norms and published track benchmarks.
- Jump Height108%
- Jump Power119%
- Explosiveness128%
- Hop RSI76%
- Hamstring83%
- Hip Iso-Push93%
- Knee Iso-Push72%
- Ankle Iso-Push88%
The read
A powerful athlete. Jump power sits near the 87th percentile, and she produces force fast. Maximal strength is the gap. Hip, knee, and ankle force in run-specific positions falls below college and elite track standards. The left hamstring is the clearest issue, and limited left hip extension adds to it.
Top priorities
- 1Left hip extension and spinal rotation. The left hip does not extend past neutral, and limited right spinal rotation restricts the end of each left stride.
- 2Hamstring strength and balance. Low overall hamstring force, with the left side 31% behind the right.
- 3Maximal strength. Raising force at the hip, knee, and ankle should lift her power and the spring she gets from her tendons.
Left vs right
The marker shows the 10% flag line. Amber is 10 to 15%, red is 15% or more.
Keep scrolling for a masters runner profile.
Run Lab Profile
A real client, shared without identifying details. Male masters distance runner in his late 50s, looking for guidance and a safe build in mileage. Scored against VALD male endurance norms, which skew young.
- Jump Height53%
- Jump Power61%
- Hop RSI63%
- Hamstring Right84%
- Hamstring Left104%
- Hip Abduction76%
- Hip Adduction96%
The read
A solid strength base. Power and reactive numbers read low against a young endurance pool, but for his age they land around the 72nd percentile. The findings that matter most are a large single-leg gap and a weaker right hamstring. Gait video showed a stiff stride with limited hip extension. Closing these gives him the capacity to build mileage safely.
Top priorities
- 1Single-leg control. A 31% single-leg jump gap is the clearest deficit to close.
- 2Right hamstring strength. At 84% of target and 20% behind the left.
- 3Power and spring. Low-level plyos build reactive strength with no fall risk.
- 4Open the hip. Tight hip flexors limit hip extension. Mobility work restores a longer, smoother stride.
- 5A safe mileage build. Re-testing shows when his body is ready for the next step up in weekly miles.
Left vs right
The marker shows the 10% flag line. Amber is 10 to 15%, red is 15% or more.
How Run Lab works
Three phases. The same process we use with every runner, from first-time racers to state champions.
- 01
Consult and assess
We film your stride in slow motion, test force and strength on VALD force plates and dynamometers, and run a running-specific mobility and stability exam.
- 02
Design
We turn the results into a detailed strength, plyometric, and mobility plan built around your limiter and your race goals.
- 03
Execute and perform
You train through the Bridge Athletic app. We re-test and adjust so the gains keep coming.
Built for runners, not copied from a magazine
No pages of leg lifts. Every session follows the order we use with our competitive runners, so the hard work lands when you are fresh.
We work with your coach
Our focus is strength, mobility, and plyometrics. We also help adjust your mileage when your testing or an injury calls for it. Your coach keeps ownership of your running plan, and we coordinate with them so everything points toward your race.
- 01
Dynamic warm-up
Lunges, skips, and drills to get ready to run.
- 02
Plyometrics
Hops and bounds for stiffness and spring.
- 03
Key strength
The big lifts, trained heavy while you are fresh.
- 04
Isolated strength
Calves, hamstrings, and hips, the runner-specific work.
- 05
Mobility cool-down
Static mobility at the end, where it belongs.
Your plan, on your phone
Pro and Elite programs live in the Bridge Athletic app. Every session is laid out, every exercise has a demo video, and Elite runners message their PT right in the app.


Running is what we do
You want to race faster and stay healthy through a full season. We get it. Runners are the heart of what we do.
“With his help I was back to running a full marathon within five months after partial knee surgery.”
PROMPT runner
Published with VALD
Our founder has published with VALD and presents to clinicians on force plate testing for runners.
Measured, not guessed
VALD force plates and dynamometers, the same technology professional teams and Olympic marathoners use.
Scored against runners
Your results are compared to endurance-athlete norms, not general population numbers.
Specialist-led
Our team is led by a board-certified orthopedic specialist who is also a certified strength and conditioning specialist.
Run Lab packages
Running performance evaluation and gait analysis. Three ways in, built for the runner with a goal race on the calendar. Not sure which fits? We will help you choose at your consultation.
Baseline
For the runner who wants expert eyes on their form.
- Slow-motion video gait analysis
- Running-specific mobility exam of the foot, ankle, knee, hip, and spine
- One to two targeted strength tests chosen from what the exam finds
- A written summary with your corrective drills and priorities
Pro
For the PR chaser who wants real numbers behind the feedback.
- Everything in Baseline, plus:
- VALD force plate battery: countermovement jump, hop jump, Nordic, hip adduction and abduction, and run-specific isometrics
- Hand-held dynamometry for objective hip strength
- Percentile report scored against endurance running norms, with left to right imbalances flagged on every test
- A corrective and strength program built from your results, delivered in the Bridge Athletic app
Elite
For the runner who wants a coach in their corner for a full training block.
- Everything in Pro, plus:
- 8 weeks of programming, a 40-minute re-test, then 8 more weeks built on the new results
- Unlimited communication with your PT through the Bridge Athletic app messenger
- PT visits at $95 if your exam shows hands-on care would help
Run Lab questions
What is Run Lab?
Run Lab is the running assessment and training service at PROMPT Physical Therapy & Performance in Knoxville, TN. We combine slow-motion gait analysis, VALD force plate testing, and hand-held dynamometry, then build a strength, plyometric, and mobility program for your running.
Who is Run Lab for?
Competitive runners from the 5K to the marathon, including masters runners. It also fits runners coming back from injury who want to return stronger than before.
What happens during a running assessment?
We film your stride in slow motion, test how you produce and absorb force on VALD force plates, measure hip, knee, ankle, and hamstring strength, and run a running-specific mobility and stability exam.
How much does Run Lab cost?
Baseline is $150 for a 40-minute visit. Pro is $250 for an 80-minute visit with full testing, a results report, and a program. Elite is $695 for a 16-week program with a re-test and unlimited messaging with your PT.
Do you help with my running plan?
Yes. Our focus is strength, mobility, and plyometrics, and we help adjust your mileage when your testing or an injury calls for it. If you have a coach, we work with them and support their program rather than replacing it.
How is my program delivered?
Pro and Elite programs are delivered in the Bridge Athletic app, with a demo video for every exercise. Elite runners message their PT directly in the app.
Is the assessment done in person?
Yes. Force plate and strength testing happen in person at our Knoxville clinic.
Find your limiter. Then fix it.
Book a consultation. Tell us your next race, and we will match you to the right package.

In this Q&A, Paul Wilson, PT, DPT, OCS, ATC, CSCS, CMPT, shares how he integrates ForceDecks and DynaMo to set rehab guidelines and benchmarks for distance runners using objective force metrics.